7 Tips to Calculate Spicy Hot Pot Operating Fees?
Running a spicy hot pot restaurant involves more than counting ingredients and rent. Spicy Hot Pot Operating Fees can shift quickly with meat prices, electricity use, staffing levels, and table turnover. A busy Saturday may look profitable, yet excessive waste or unpaid delivery commissions can quietly reduce the margin. Small leaks matter.
Restaurant consultant David Scott Peters often stresses, “You can’t manage what you don’t measure.” This principle fits hot pot operations closely. Owners should record broth usage, sauce consumption, gas or induction power, labor hours, cleaning supplies, packaging, maintenance, and local permit expenses. These figures create a practical cost map. Guesswork does not.
This guide presents seven useful ways to calculate Spicy Hot Pot Operating Fees with greater accuracy. It considers fixed costs, variable costs, food waste, labor allocation, equipment depreciation, marketing spending, and emergency reserves. A single table may use several kilograms of sliced beef, dozens of sauce portions, and hours of ventilation. Those details belong in the calculation.
The process is not perfect. Supplier prices change. Customer demand changes faster. Some owners also underestimate refrigerator repairs or seasonal utility bills. That weakness deserves attention. Reviewing figures weekly can reveal patterns before they become serious problems. The goal is not merely to produce a low number. It is to build a realistic operating picture, protect service quality, and support responsible pricing decisions. Each restaurant needs its own data, tested assumptions, and regular financial review.
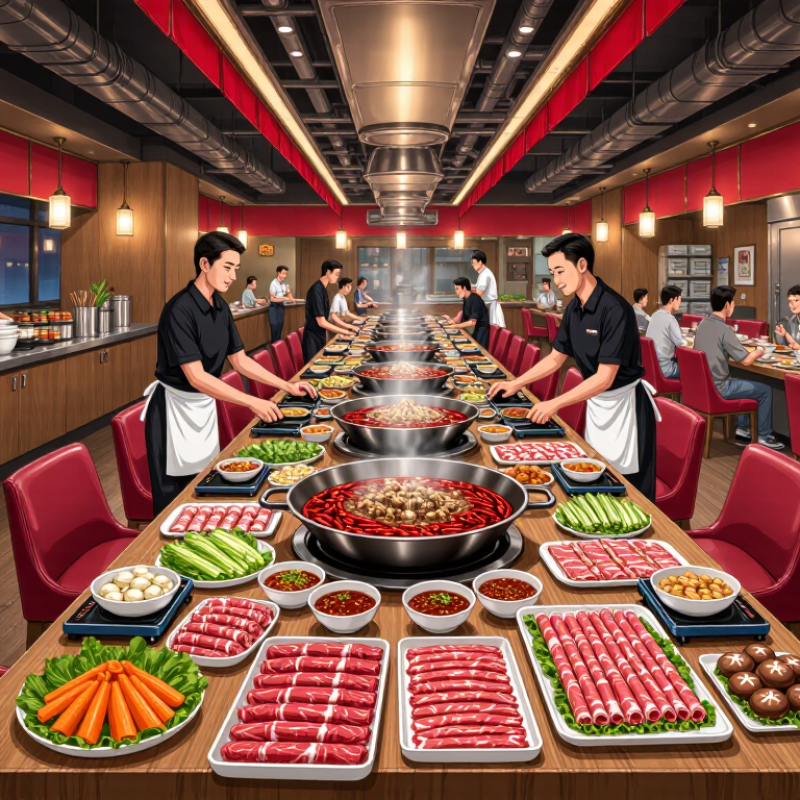
Define the Main Categories of Spicy Hot Pot Operating Fees
A spicy hot pot budget needs seven operating-fee categories: ingredients, labor, rent, utilities, equipment, marketing, and administration. The National Restaurant Association’s 2024 State of the Restaurant Industry report identifies food and labor as major cost pressures. In practice, ingredients often require 28–35% of sales, while labor may reach 25–35%, depending on service style and local wages. These are planning ranges, not promises.
Ingredient fees include broth bases, sliced meat, vegetables, sauces, rice, and daily spoilage. A busy kitchen still loses money when mushrooms wilt in an uncovered tray.
Labor includes cooks, servers, cleaners, payroll taxes, training, and overtime.
Rent should be separated from common-area charges, insurance, and property taxes.
Utilities deserve close attention because induction burners, exhaust systems, refrigeration, and hot-water equipment run continuously. The U.S. Energy Information Administration’s commercial energy data supports tracking electricity by operating period, rather than guessing from monthly bills.
Equipment fees include maintenance, replacement parts, kitchen software, and safety inspections.
Marketing covers local listings, photography, promotions, and customer retention.
Administration includes licenses, accounting, payment processing, waste removal, and pest control.
Some operators undercount these smaller fees. That mistake is expensive. Review each category weekly, compare actual invoices with sales, and question every “normal” percentage.
Calculate Fixed Costs for Rent, Equipment, Licenses, and Depreciation
A spicy hot pot budget begins with fixed costs, not soup base prices. The National Restaurant Association’s 2024 Operations Data Abstract reports median occupancy costs near 5.7% of sales for full-service restaurants. Use this as a warning, not a target. A high-rent corner can destroy margins before the first customer arrives.
Tip 1: Convert rent into a monthly figure, including service charges, property fees, and required insurance. Tip 2: List equipment separately. Induction burners, tables, ventilation, refrigeration, sinks, and fire-safety systems need individual prices. Tip 3: Request three supplier quotations. My first estimate usually misses installation. Tip 4: Add licenses, inspections, permits, and renewal fees. These costs vary by location, so confirm them with local authorities. Tip 5: Record deposits as cash requirements, but do not treat refundable deposits as monthly expenses.
Tip 6: Calculate depreciation before opening. Under IRS guidance, many restaurant assets use MACRS depreciation, but the correct recovery period depends on the asset and tax situation. Ask a qualified accountant. Tip 7: Divide annual fixed costs by realistic annual covers, not optimistic weekend traffic. For example, £120,000 in yearly fixed costs and 48,000 covers create £2.50 per cover. That figure should enter every pricing discussion. Keep a replacement reserve too. Burners fail, chairs loosen, and extraction systems age. The National Restaurant Association also emphasizes tight cost control as labor and operating expenses remain significant pressures. I would review the model monthly, because the original forecast will probably be imperfect.
7 Tips to Calculate Spicy Hot Pot Operating Fees
Estimated annual fixed costs for a small hot pot restaurant
This illustrative budget assumes a small urban restaurant with annual rent of $48,000, approximately $60,000 in equipment depreciated over five years, annual permits and licenses of $2,000, insurance of $4,800, and base utilities of $7,200. Actual costs vary by location, restaurant size, lease terms, and local regulations.
Estimate Variable Costs for Ingredients, Labor, Utilities, and Packaging
7 Tips to Calculate Spicy Hot Pot Operating Fees
Tip 1: List every ingredient used in one serving, including broth, meat, vegetables, sauces, and garnishes. Weigh portions during a real service, not only during planning. Small ladle differences can quietly increase costs. Tip 2: Add preparation, cooking, serving, cleaning, and closing hours to labor costs. Include overtime, payroll taxes, and temporary staff payments where applicable. Tip 3: Calculate labor by shift. A busy evening may need more servers, but a slow afternoon still creates fixed pressure.
Tip 4: Record electricity, gas, water, and refrigeration use separately when possible. A utility meter gives better evidence than a rough guess. If meters are shared, divide costs using operating hours and equipment demand. Tip 5: Measure packaging per takeaway order. Count containers, lids, bags, sauce cups, napkins, and utensils. Packaging waste is easy to overlook. Tip 6: Track actual invoices weekly in a simple spreadsheet. Compare expected ingredient costs with purchases, stock losses, and spoilage. My first estimates were too optimistic.
Tip 7: Test three scenarios: normal sales, weak sales, and peak demand. Calculate variable cost per guest in each case. Review the numbers after four weeks, then adjust portions or purchasing methods carefully. Do not force every expense into one average. Suppliers change prices, guests waste food, and demand is rarely smooth. A reliable estimate should show uncertainty, not hide it.
7 Tips to Calculate Spicy Hot Pot Operating Fees? - Estimate Variable Costs for Ingredients, Labor, Utilities, and Packaging
| No. | Cost Area / Tip | Calculation Basis | Unit Cost | Monthly Volume | Estimated Monthly Cost | Share of Variable Cost |
| 1 | Food Ingredients
Meat, seafood, vegetables, tofu, noodles, spices, and sauces | Average ingredient cost per guest × number of guests | $8.20 / guest | 2,400 guests | $19,680 | 55.4% |
| 2 | Hourly Labor
Kitchen, service, cashier, and cleaning staff | Paid labor hours × blended hourly wage, including payroll burden | $15.50 / hour | 960 hours | $14,880 | 41.9% |
| 3 | Utilities
Gas, electricity, water, ventilation, and refrigeration usage | Estimated utility consumption attributable to daily operations | $0.85 / guest | 2,400 guests | $2,040 | 5.7% |
| 4 | Takeaway Packaging
Containers, lids, bags, labels, napkins, and utensils | Packaging cost per takeaway order × takeaway orders | $0.72 / order | 720 orders | $518 | 1.5% |
| 5 | Payment Processing
Card, mobile wallet, and online ordering transaction fees | Average monthly sales × estimated processing rate | 2.7% of sales | $43,200 sales | $1,166 | 3.3% |
| 6 | Waste and Spoilage
Trim loss, expired items, preparation waste, and order errors | Food purchasing cost × estimated waste rate | 4.0% of food cost | $19,680 food cost | $787 | 2.2% |
| 7 | Cleaning and Consumables
Detergent, sanitizer, gloves, paper towels, and disposable supplies | Consumable cost per guest × number of guests | $0.32 / guest | 2,400 guests | $768 | 2.2% |
| Total Estimated Monthly Variable Costs | $39,839 | 112.2%* |
Planning assumptions: 2,400 monthly guests, $18.00 average sales per guest, 30 operating days, 30% takeaway share, and 960 paid labor hours per month. The cost-share percentages are calculated against food, labor, utilities, packaging, processing, waste, and consumables combined; the total may exceed 100% because the payment-processing percentage is based on sales rather than variable-cost totals.
Measure Daily Sales, Customer Spending, and Operating Frequency
7 Tips to Calculate Spicy Hot Pot Operating Fees
Start with daily sales, not monthly guesses. Record table turnover, average check, and payment totals after discounts. The National Restaurant Association’s 2024 State of the Restaurant Industry Report projected U.S. restaurant sales above $1 trillion. That scale shows why small daily errors matter. Divide daily revenue by covers to measure customer spending. Then compare weekdays, weekends, lunch, and dinner. A hot pot table may spend 80 minutes, while another stays for two hours. That difference changes revenue capacity.
Track operating frequency with three practical measures: covers per day, table turns, and returning customers. Calculate table turns by dividing daily covers by available tables. For example, 120 covers across 20 tables equals six turns. Record the result weekly. Use a simple sheet. Include food purchases, wages, rent, utilities, delivery fees, cleaning, and equipment repairs. The U.S. Bureau of Labor Statistics reported continued food-away-from-home price growth in recent CPI data, so ingredient costs need frequent review. Fixed estimates become weak when broth, meat, or energy prices move.
Test customer spending by service period. A lower average check may still work with faster table turnover. However, faster service can reduce satisfaction if staff rush refills. That is a real operating risk. Compare gross sales with contribution margin, not sales alone. Review the numbers every seven days, then question unusual results. My own practical mistake would be trusting a strong Saturday too quickly. One busy night cannot prove a stable operating model. Industry data guides the decision, but your dining room supplies the evidence.